Lesson 3: Making Data Visualizations
Overview
Now that students have had the chance to see and evaluate various data visualizations, they will learn to make visualizations of their own. This lesson teaches students how to build visualizations from provided datasets. The levels in Code Studio provide a detailed walkthrough of how to use Google Sheets to create several different kinds of charts. While this lesson focuses on the Google Sheets tool, other tools may be substituted at the teacher’s discretion, and MS Excel support is coming soon to the lesson.
The main activity teaches students to build different chart types (scatter, line, and bar charts) from a single data set. It should be emphasized to students that the purpose of this lesson is to explore and experiment with creating different types of visualizations, not to build the perfect chart. Students will have a chance to create and customize their own charts. At the end of class, students compare their custom visualizations with those of their classmates.
Purpose
Being able to create meaningful data visualizations is extremely important in order to effectively communicate information about large data sets. It's also important to be able to use visualizations to simply “look” at data that is too complex to make sense of by looking at the raw data alone. Any computer scientist working with data should have some skills and facility with producing visualizations of the data to get a sense of what it contains. Visualizing the data allows you to see patterns, trends or relationships you might otherwise not.
The most important piece of this lesson is not learning to create the prettiest chart; it’s about using charts to “tell the story” of what’s really going on in the data. Different charts are more or less appropriate for communicating this story, depending on the data. The point of having students explore different chart types is to help them build visualizations that reveal trends or connections in the data that are too hard to see by just looking at a data table in a spreadsheet.
Agenda
Getting Started
Activity
Wrap-up (10 mins)
Assessment
Extended Learning
View on Code Studio
Objectives
Students will be able to:
- Select the appropriate type of data visualization to discover trends and patterns within a dataset.
- Create a bar, line, and scatter chart from a dataset using a computational tool.
- Use the settings of a data visualization tool to manipulate and refine the features of a data visualization.
Preparation
Links
Heads Up! Please make a copy of any documents you plan to share with students.
For the Students
Teaching Guide
Getting Started
Survey Reminder
Survey Reminder: Give students a few minutes to fill out the class tracker survey that you started in Lesson 7 - Introduction to Data.
Discussion Goal
We want to motivate students' desire to create some visualizations on their own. Build on the "Good/Bad Visualiztions" lesson. Some responses students might give:
- A large data set is too big to understand by looking at a table in a spreadsheet.
- Creating a data visualization with a computer is faster and more accurate than creating one by hand.
Using visualization to discover connections and patterns
Prompt:
"Do you have to use a computer to create a data visualization? What are some reasons that you need to use a computer to manipulate data?"
Briefly Share and discuss responses
- Do a quick think-pair-share (or other strategy)
Transitional Remark
Taking data from its raw state to the point where you can create a meaningful visualization involves several steps. Today we’re going to use visualization in attempt to discover things in the data we might not otherwise see.
It takes practice to create good visualizations. Today, we’ll get our feet wet by learning to create charts using Google Sheets.
Make a Quick Visualization
warm up goal
This is intended to only be a brief activity to illuminate issues around making visualizations and how much variety there can be, and letting the students be creative and share with each other.
Remarks
When trying to understand data, having a visualization, or picture of it, is often much more effective at communicating information than the raw data itself.
Making a good visualization of data is often challenging but can be fun and very creative, and we're about to start making our own. Let's try one, quickly.
Scenario:
Teaching Tip
Please note: this data is completely fabricated and is only intended to serve the purposes of the warm up. It is intentionally slightly ambiguous. If students ask questions seeking clarification that's a good sign, but you might have to simply respond: "Well, this is the data we have".
There are no right or wrong answers here as long as students attempt to represent the data in a different way somehow.
Here is some data: On some survey 2,000 people were asked, "What do you do when you're bored?". Here are the most common responses by age group.
| age | most common response | number | out of |
|---|---|---|---|
| 18 and under | texting | 157 | 500 |
| 19-64 | watching TV | 247 | 1200 |
| 65+ | reading | 54 | 300 |
| all ages | talking with friends | 451 | 2000 |
For example: of the 1200 people surveyed between the ages of 19-64, 247 said "watching TV" which was the most common of any other responses to the question for that age group.
Prompt:
-
"Take a few minutes by yourself and try to make a visual, graphical, explanation of this data. Try to communicate something about through drawing while remaining true to the results of the data."
-
Give students 3-5 minutes to draw.
Compare and Discuss:
- Have students compare what they drew with an elbow partner and point out similarities and differences.
Prompts:
- "In this exercise what was challenging?"
- "What kinds of things were visually effective at communicating information?" <-- ALT: "What where the characteristics of the visualizations that effectively communicated this information visually?"
Activity
Teaching Tip
Remember the point here is not to make the prettiest chart, but choose the chart type that makes the most sense for the data you've got and the story you're trying to tell.
You can also point out to students that finding “no correlation” or “no relationship” is actually just as interesting as finding a strong correlation or relationship. For example, if you examine the difference between men and women in average rating of Star Wars, you will see virtually no difference! That’s interesting!
Make scatter, line, bar, and custom charts
![]() Transition to Making Data Visualizations on Code Studio
Transition to Making Data Visualizations on Code Studio
- The "Activity Guide" for this lesson is all laid out in Code Studio.
- Put students into pairs and send them to Code Studio.
- The steps students go through are laid out below.
- Please note the purpose and teaching tips on this lesson for perspective.
While students are working, circulate the room to help and encourage.
- Use KEY - Making Data Visualizations Target Charts - Answer Key which shows what students should be trying to create. It also explains a few common mistakes that students might make.
| Teacher Code Studio Reference | |
|---|---|
| Students are asked to make a copy of the data set in their Google Drive. (Students must be logged into Google Drive for this step to work.) When they open the link to the CSV file, they can click the “Open” button next to the green Google Sheets logo, which will make a copy of the CSV in their personal Drive folder. |  |
| Students follow step-by-step instructions to create a scatter plot showing the average movie rating by age of reviewer | 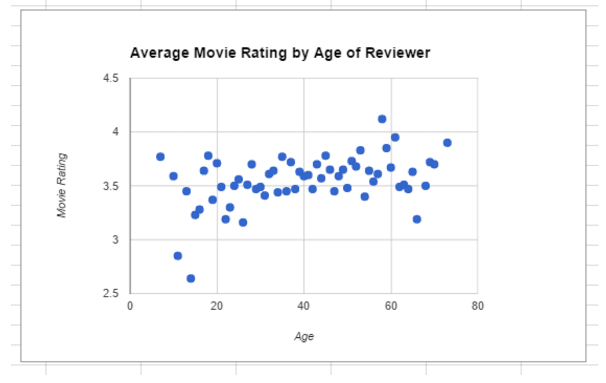 |
| Students follow step-by-step instructions to create a line chart showing the average movie rating by age of reviewer, broken down by gender. |  |
| Students follow step-by-step instructions to create a bar chart showing the number of ratings by age of reviewer, broken down by gender. | 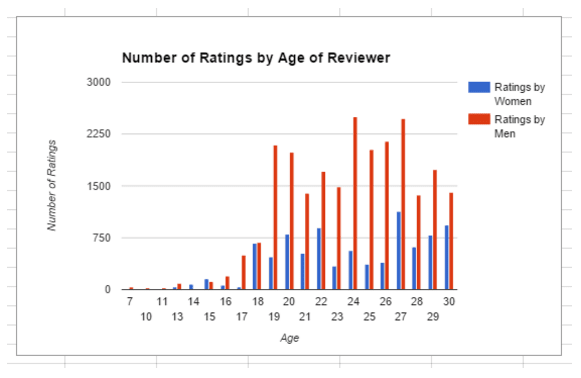 |
| Students experiment with creating their own charts on the same data set NOTE: they’ll get a chance to explore many different data sets in the next lesson. It should be emphasized that the purpose of this part of the lesson is to freely explore the chart tool and discover connections in the data; students should not fixate on creating the perfect chart. |
Wrap-up (10 mins)
Compare with a partner
With partners or in small groups, have students discuss the following prompt. Once students have shared with each other, have students report back to the class about the charts they made and what they learned.
Prompt: What was the most interesting visualization you were able to create? What did it help you discover about the data?
Assessment
Assessment Possibilities
-
Score or review a written response to the reflection prompt from the wrap up (also found in code studio)
-
Make a simple rubric (a checklist basically) for the steps of the activity that students were supposed to go through:
- Scatter Plot
- Line Chart
- Bar Chart
- Optional: something on their own
Extended Learning
If you want additional sources of data visualizations, consider the following sources:
- Daily Infographic: http://www.dailyinfographic.com/
- Infographics Archive: http://www.infographicsarchive.com/
- Lesson Overview
- Teacher Overview
- Student Overview
Target Charts: Making Data Visualizations
- Downloading the Data Set_2018_2019
- Student Overview
Making Data Visualizations
There are many different kinds of charts that are used to visualize data. In this lesson, you will learn to make scatter, line, and bar charts, but there are many other types of visualizations that people use to interpret data in different ways. Look through the Data Visualization 101 Guide and familiarize yourself with the different chart types, paying particular attention to the scatter, line, and bar charts.
- Disclaimer: This lesson is about using charts to explore trends in the data - not about creating the world's greatest chart. While the early parts of the lesson will walk you through very specific steps to make a particular chart, by the end of the lesson you will be creating your own customized charts to see what trends you can discover in the data.
Downloading the Data Set
Do This: Click the link below to see the data set you will be using for the next few levels:
To make your own copy in your local Google Drive, click here: MovieRating_avgRatingByAgeByGender (You will need to make sure that you are logged into your Google Drive account.)
- Making a Scatter Plot_2018_2019
- Student Overview
Making a Scatter Chart
The first type of chart you're going to build is a scatter chart. Scatter charts are useful for finding relationships between two types of data. In this exercise, you will build a scatter chart that shows the relationship between movie reviewer age and average movie rating.
Select Data
Do This: Select the "age" and "avg rating" columns, as show below.

Select the "age" and "avg rating" columns
- Hint: To select an entire column, click the top cell (ex. A1), then hold down the "SHIFT" key and select the last cell from the last column you want (ex. B62).
Insert Chart
Google gives suggestions of what kind of chart you can make from your data, but for this exercise you're going to ignore those suggestions and make the chart yourself.
Do This: Go to the Chart Editor by clicking Insert -> Chart.
- Try a few chart types. Notice the preview changing.
- Eventually select "Scatter Chart."
- Experiment with the check boxes on the right, and notice how the chart preview changes.
- Check "Use row 1 as headers." This makes sure your chart uses the column names in the first row of your spreadsheet.
- Check "Use column A as labels." This tells the chart that column A is your horizontal or "x" axis.
- Click "Insert" to add your chart to the spreadsheet.
 Change chart type and insert your scatter chart into the spreadsheet.
Do a Visual Check
At this point, your chart should look something like this:

Do This: Take a moment to look at your visualization. You can switch between "View" and "Edit" mode with this button.

Can you understand what the chart is showing? Even though the title and axis labels are wrong or don't appear, you should be able to decode the basics of your chart.
- What does this chart help you notice about the data?
- Which age groups had the highest average ratings?
- Which age groups had the lowest?
- What other connections and trends can you see?
After you've thought about these questions, move on to the next section to learn how to make a line chart.
- Making a Line Chart_2018_2019
- Student Overview
Making a Line Chart
You can use many different kinds of charts to look at the same data. You'll now investigate different columns of your data with a line chart. Line charts are helpful for showing the progression of values over time. In this case you will be showing how the average movie rating changes with the reviewer's age.
Select Data
Do This: Select the "age," "avg rating women," and "avg rating men" columns.
- Select the first column of data using the mouse.
- Hold down the "Control" key, (or "Command" on a Mac) and select the additional columns of data.
Using Hotkeys
To select cells in non-adjacent columns, you need to use some fancy hotkeys:1. First select the cells from the first column (i.e., A1 through A62) using the SHIFT+click combination.
2. Then, hold down COMMAND (if using a Mac) or CONTROL (if using Windows) and click to select the first cell of the next column (i.e., D1).
3. Finally, hold COMMAND/CONTROL and SHIFT simultaneously, then click to select the last cell in the new column (i.e., D62).
4. Repeat steps 2-3 for any additional columns you want to select (i.e., F1 through F62).
 Select the cells to include in the chart.
Insert Chart
Do This: Select Insert -> Chart from the main toolbar to open the Chart Editor.
- Set the chart type to "Line chart."
- Check the boxes for "Use row 1 as headers" and "Use column A as labels."
- Click "Insert" to add your chart to the spreadsheet.
 Change chart type and insert your line chart into the spreadsheet.
Do a Visual Check
At this point, your chart should look something like this:

Once your chart looks close to the one above, switch to View mode and take a moment to look at your visualization.
- What does this chart help you notice about the data?
- For which ages were the average ratings similar between men and women?
- For which ages were they different?
- What other connections and trends can you see from this chart?
After you've thought about these questions, move your line chart off to the side of your spreadsheet. Don't delete it! You will be coming back to it later in the lesson. Then move on to the next section to learn how to make a bar chart.
- Making a Bar Chart_2018_2019
- Student Overview
Making a Bar Chart
In this exercise, you will use some different columns in the spreadsheet to create a bar chart. Bar charts are useful for viewing data grouped by different categories.
Select Data
Do This: Select the "age," "number of women," and "number of men" columns
- Select the first column of data using the mouse
- Hold down the "Control" key, (or "Command" on a Mac) and select the additional columns of data
Using Hotkeys
To select cells in non-adjacent columns you can also use hotkeys:- Select the cells from the first column (i.e., A1 through A62) using the SHIFT+click combination.
- Hold down COMMAND (if using a Mac) or CONTROL (if using Windows) and click to select the first cell of the next column (i.e., E1).
- Hold COMMAND/CONTROL and SHIFT simultaneously, then click to select the last cell in the new column (i.e., E62).
- Repeat steps 2-3 for any additional columns you want to select (i.e., G1 through G62).
 *Select the "age," "number of women," and "number of men" columns.
Insert Chart
Do This: Select Insert -> Chart from the main toolbar to open the Chart Editor.
- Set the chart type to "Column chart."
- Check the boxes for "Use row 1 as headers" and "Use column A as labels."
- Click "Insert" to add your chart to the spreadsheet.
 Change chart type and insert your bar chart into the spreadsheet.
Do a Visual Check
At this point, your chart should look something like this:
Once your chart looks close to the one above, switch to View mode and take a moment to look at your visualization.
- What does this chart help you notice about the data?
- For which ages were the number of ratings similar between men and women?
- For which ages were they different?
- What other connections and trends can you see from this chart?
After you've thought about these questions, move on to the next section to learn how to further customize your chart.
- Editing Chart Appearance_2018_2019
- Student Overview
Give Your Chart a Makeover!
You've now successfully learned to create charts! Now you'll learn to further customize the appearance of your chart, which will make your visualization easier to read and understand. This exercise will walk you through the steps to customize the line chart you created a few levels ago, but these same steps can be applied to any charts you make in the future.
Chart Title
A good chart title should effectively summarize the data story in the chart. You can change the title of your chart by double-clicking it.
Do This: Change the title of your line chart to "Average Rating by Age of Reviewer".
 Change the chart title.
Axis Labels
Your chart should include labels that indicate what the axes represent. Include measurement units, if applicable.
Do This: Rename your horizontal axis to "Age (years)" and your left vertical axis to "Movie Rating".
- Hint: You will need to right-click the chart to access the axis labels.
 Add axis labels.
Legend
You may notice that the labels in your legend are not very official-looking. To change the text that appears on the chart, you have to change the text in the column headers themselves.
Do This: Change the legend labels to "Avg. Rating: Women" and "Avg. Rating: Men".
- Note: If you can't read your legend labels because the text is overlapping, try adjusting the style (bold, italics, etc.) of your legend.
 Change the labels for your chart's legend.
Ranges
Examine both the far right and far left sides of your chart. Notice that both the men's and women's lines do not run continuously across the entire graph. The men's line has a gap on the left side of the chart, and the women's line ends shortly after age 55 and only has a few dots after that. These discontinuities appear because there are gaps in the data set.
Do This: Adjust the boundaries for your chart's x-axis using the "Min" and "Max" text inputs.
- Try to minimize the discontinuities shown in your chart while still displaying as much of the two lines as possible.
- If you want to adjust the boundaries for the y-axis, select "Left vertical" from the "Axis" dropdown menu and adjust "Min" and "Max" for that axis.
 Adjust the minimum and maximum x-values for the chart.
- Making Data Visualizations - Free Play
- 7
Student Instructions
Now It's Your Turn!
Now that you know the basics of how to create charts in Google Sheets, try making some visualizations of your own!
You can continue exploring the spreadsheet from the previous exercises, or download the additional data set below:
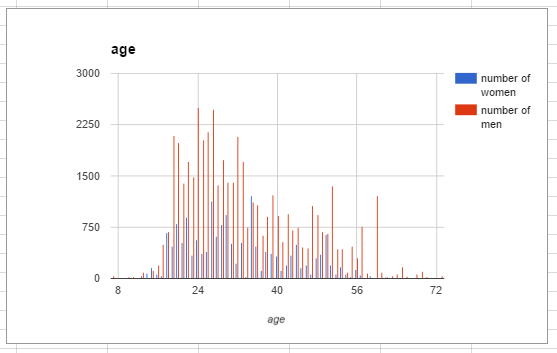
Remember, this exercise is all about exploring trends and discovering connections in the data. Don't stress about trying to create the perfect chart. Experiment with different chart types, try using different combinations of columns, and see what else you can learn about this data!
- Check Your Understanding
- 8
Student Instructions
What was the most interesting visualization you were able to create with the data set provided? What did it help you discover about the data?
Make sure that your response includes the following:
- What type of chart it was
- What specific data it plotted
- What it helped you discover and/or why it was the most interesting to you
Try to keep your response to 150 words or less (5-7 sentences).
Standards Alignment
View full course alignment
Computer Science Principles
1.2 - Computing enables people to use creative development processes to create computational artifacts for creative expression or to solve a problem.
1.2.5 - Analyze the correctness, usability, functionality, and suitability of computational artifacts. [P4]
- 1.2.5A - The context in which an artifact is used determines the correctness, usability, functionality, and suitability of the artifact.
- 1.2.5B - A computational artifact may have weaknesses, mistakes, or errors depending on the type of artifact.
- 1.2.5C - The functionality of a computational artifact may be related to how it is used or perceived.
- 1.2.5D - The suitability (or appropriateness) of a computational artifact may be related to how it is used or perceived.
3.1 - People use computer programs to process information to gain insight and knowledge.
3.1.1 - Use computers to process information, find patterns, and test hypotheses about digitally processed information to gain insight and knowledge. [P4]
- 3.1.1D - Insight and knowledge can be obtained from translating and transforming digitally represented information.
- 3.1.1E - Patterns can emerge when data is transformed using computational tools.
3.1.2 - Collaborate when processing information to gain insight and knowledge. [P6]
- 3.1.2A - Collaboration is an important part of solving data driven problems.
- 3.1.2B - Collaboration facilitates solving computational problems by applying multiple perspectives, experiences, and skill sets.
- 3.1.2C - Communication between participants working on data driven problems gives rise to enhanced insights and knowledge.
- 3.1.2D - Collaboration in developing hypotheses and questions, and in testing hypotheses and answering questions, about data helps participants gain insight and knowledge.
- 3.1.2F - Investigating large data sets collaboratively can lead to insight and knowledge not obtained when working alone.
3.1.3 - Explain the insight and knowledge gained from digitally processed data by using appropriate visualizations, notations, and precise language. [P5]
- 3.1.3A - Visualization tools and software can communicate information about data.
- 3.1.3B - Tables, diagrams, and textual displays can be used in communicating insight and knowledge gained from data.
- 3.1.3C - Summaries of data analyzed computationally can be effective in communicating insight and knowledge gained from digitally represented information.
- 3.1.3D - Transforming information can be effective in communicating knowledge gained from data.
- 3.1.3E - Interactivity with data is an aspect of communicating.
CSTA K-12 Computer Science Standards (2017)
DA - Data & Analysis
- 3A-DA-11 - Create interactive data visualizations using software tools to help others better understand real-world phenomena.
- 3B-DA-05 - Use data analysis tools and techniques to identify patterns in data representing complex systems.
- 3B-DA-06 - Select data collection tools and techniques to generate data sets that support a claim or communicate information.
- 3B-DA-07 - Evaluate the ability of models and simulations to test and support the refinement of hypotheses.
IC - Impacts of Computing
- 3A-IC-25 - Test and refine computational artifacts to reduce bias and equity deficits.