Lesson 1: Introduction to Data
Overview
In this kickoff to the Data Unit, students begin thinking about how data is collected and what can be learned from it. To begin the lesson, students will take a short online quiz that supposedly determines something interesting or funny about their personality. Afterwards they will brainstorm other sources of data in the world around them, leading to a discussion of how that data is collected. This discussion motivates the introduction of the Class Data Tracker project that will run through the second half of this unit. Students will take the survey for the first time and be shown what the results will look like. To close the class, students will make predictions of what they will find when all the data has been collected in a couple weeks.
Purpose
This lesson introduces many of the lessons and themes that will run through the unit. Students are introduced to the Class Data Tracker and the fact that they will be collecting and analyzing their own data in a couple weeks. They also begin thinking about the many ways data impacts their lives and how it can be used. While the primary goal of this lesson is to get ideas and processes in place for the rest of the unit, there are many places where students can start asking interesting questions about where and how data is collected, who is collecting it, and how they are using it.
Agenda
Teacher Setup (10 mins)
Getting Started (20 mins)
Activity (25 mins)
Wrap-up
View on Code Studio
Objectives
Students will be able to:
- Develop a hypothesis about student behavior over time, based on a small sample of data.
- Describe sources of data appropriate for performing computations.
Preparation
- Teacher Setup for Google Forms (see Teacher Setup in Teaching Guide)
Links
Heads Up! Please make a copy of any documents you plan to share with students.
For the Teachers
- Class Data Tracker Setup Guide - Google Form Setup (includes template)
For the Students
Teaching Guide
Teacher Setup (10 mins)
Teacher Setup Guide for Data Tracker Project
This lesson requires a one-time special setup in order to create a form for data collection with the students in your class. Once you have it setup you will use it for several weeks.
Please click the link to see the full Class Data Tracker Setup Guide - Google Form Setup (includes template).
In a nutshell the guide has you:
-
Make a copy of a Google Form (short link to template)
-
Share a link to the form with your students
There are also notes on editing the survey questions if you want to -- we chose the questions so that certain properties would emerge later on. If you want to change the questions just ensure that you'll get the same properties or later lessons might not work.
After the setup you should have:
- A copy of a Google form in your Google Drive
- A spreadsheet that will collect responses from the form in your Google Drive
- A link that students should use to fill out the survey
Students fill out this form every day or as frequently as possible over the next few weeks. We will look at this later in the unit. You can place the form and spreadsheet documents wherever you like in your Google Drive. They are yours now.
Getting Started (20 mins)
Opening Remarks
Transitioning to a new chapter. These remarks are meant to help you make a bridge between the Encode and Experience activity and this chapter about manipulating and visualizing data.
- The last project you did (Encoding an Experience) was about organizing and structuring digital data to represent complex information.
- You did it by thinking about bits.
- In reality we typically don't have to break digital data down all the way to bits in order to work with it, but understanding that digital data at its root is just bits gives you insights into working with larger data sets.
- We are about to embark on a new series of lessons where you will work with real data sets and learn how to use to tools to explore and extract information and knowledge from the data.
- One way we think about it is learning how tell stories with data. We start today!
Discussion Goal
Get students to start thinking about where they interact with and produce data in their lives, by looking at their past experiences with online quizzes and surveys, to bridge the gap to a long-term class data collection activity.
Pop “Quiz"
Before saying anything, point students to this online quiz and have them complete it: How Much of a Left and Right-Brained Person Are You? - Link
Share Results: Allow students to share and compare their percentages of left and right-brainedness. It should be mildly amusing. The point of this little exercise will be revealed after the discussion.
Remarks
This unit will address the topic of data more deeply. In computing, we’re interested in where data comes from, what structure or formats it comes in, and most importantly, what kind of knowledge or information we can extract from that data using computational tools.
Prompt:
"People say there is data all around us. What do you think that means? Brainstorm as many examples of data as you can think of."
For each one, try to answer:
- Who is generating the data?
- Where is the data being stored or saved? Who owns it?
Discussion Goal
- Make sure to point out that, for most of these examples, people are generating the data through their own actions, though sometimes they might not be aware of it.
- In most cases this data is stored somewhere else, and by someone else.
- The point to make is not necessarily a concern for privacy (yet) but simply the fact that there is lots of data gathered by individuals and organizations, which makes it possible to compute with/on.
- Some knowledge could be extracted from that data.
Discussion
- Give students 2 minutes to jot down ideas before sharing with a neighbor.
- Do a whip-around to get ideas out in the air, perhaps writing them on the board.
-
Student responses will vary widely and may be related to:
- cell phone data plans
- science experiments
- GPS tracking
- online shopping data
- taxes or accounting info
- sports data
Transitional Remarks
Good, you identified all kinds of places that data comes from. In this unit we’ll be looking at lots of those same examples and learning a bit about how to use, manipulate and visualize data with computational tools.
In Computer Science, sometimes we can have the computer itself generate data for us. Later in the course when we get to programming, we'll write programs that generate a lot of data.
But there are other kinds of data that can’t be generated by the computer. In particular, data about people and how they act in the real world is hard to capture without just asking them. So that’s what a lot of tools online do. They try to capture people’s responses to things because the data, in aggregate, might contain useful information that could be extracted.
That “dumb” online quiz you took at the beginning of class is an example. These quizzes ask people to reveal things about themselves, their preferences, likes and dislikes. This is data! While these online quizzes are probably innocuous, some interesting things about people could probably be discovered if the data were analyzed.
As a class, we’re going to do something similar...
Activity (25 mins)
Activity Goal
Introduce the class data tracker project. The class will collect data about themselves so that students can see trends and patterns in the class’s behavior over time.
Setup Reminder: Make sure you have prepared the Google form, and have the share link ready ahead of time. See notes above.
Remarks
As our first adventure into data, each of you is going to complete a short survey. Surveys are one of the best ways to collect data from people, and they are functionally no different from an online poll, funny quiz, or anything else that asks you for your opinion. We’re going to use our own survey, so that we can collect and see all the data.
Introduce Class Data Tracker survey.
Distribute: Share the survey link with your students and have them complete it once.
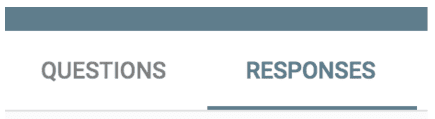 Display the Initial Responses: Once everyone has filled out the survey, show them a glimpse of the results. You can find the results from your survey by clicking the Responses tab next to the Questions tab at the top of the form you made.
Display the responses on the board. Scroll through them, giving students a chance to see the data. Try not to get hung up on issues of formatting, like a student who responded “seven hours” instead of “7” or “7 hours.”
You may want to show the raw spreadsheet view instead of, or in addition to, the default “dump” of responses shown in the form.
Briefly Discuss: Have students look at the results from the survey and discuss what they notice.
- What do you notice?
- What was surprising?
- What do the results tell you about you and your answers?
- What other information would you like?
- What kind of questions would we need to ask to find out more information?
Explain:
Teaching Tip
If necessary, introduce (or review) the term hypothesis with your students. The CSP Framework has a learning objective that reads: 3.1.1 Find patterns, and test hypotheses about digitally processed information to gain insight and knowledge. [P4] We will come back to these hypotheses when we look at the data in earnest a few lessons down the line.
Many will have probably seen the word in a science class. The Merriam-Webster Dictionary says a hypothesis is “an idea or theory that is not proven but that leads to further study or discussion.”
You are going to complete this survey every day in class for the next several weeks. By the end, we should have several hundred entries. You’ve seen the questions and have taken a quick glimpse at the results. What do you think we might be able to find out in a few weeks?
Prompt:
"Write down one or two hypotheses (predictions) about what we might be able to find out about our class, assuming that everyone fills out this survey every day for a few weeks."
Transition to wrap up.
Wrap-up
Discussion Goal
Foreshadow the class data tracker project and the rest of the Unit.
In student's hypotheses: try to focus on hypotheses that hinge on a relationship between two elements of the data For example:
- people who get more sleep tend to feel better
- predictions about trends or other patterns (e.g., I think most people will go to the movies to relax, but only on weekends).
Share:
Do a quick share-out of students’ hypotheses about what the class data will show in a few weeks.
"What kinds of predictions did you make?"
- Student responses will focus on different aspects of the data.
- Anything related to time spent doing things outside of school and how it makes you feel is fair game.
Remarks
- Those are all interesting ideas.
- Many of them will require us to perform some computations on the results to find the answers, or spot other trends or patterns.
- Over the coming weeks, we’ll collect this data, and over that time, you’ll learn some things about how to process and visualize data like this, so you can see for yourself what kinds of knowledge the data holds.
Welcome to data.
- Lesson Overview
- Teacher Overview
- Student Overview
Teacher Note: please see the lesson plan for setup instructions. You will need to provide students with a link to a survey that you create specifically for your students.
- Quick Check-In
- 2
Student Instructions
This level is an assessment or survey with multiple questions. To view this level click the "View on Code Studio" link.
Standards Alignment
View full course alignment
Computer Science Principles
3.1 - People use computer programs to process information to gain insight and knowledge.
3.1.1 - Use computers to process information, find patterns, and test hypotheses about digitally processed information to gain insight and knowledge. [P4]
- 3.1.1B - Digital information can be filtered and cleaned by using computers to process information.
- 3.1.1C - Combining data sources, clustering data, and data classification are part of the process of using computers to process information.
- 3.1.1D - Insight and knowledge can be obtained from translating and transforming digitally represented information.
- 3.1.1E - Patterns can emerge when data is transformed using computational tools.
3.1.3 - Explain the insight and knowledge gained from digitally processed data by using appropriate visualizations, notations, and precise language. [P5]
- 3.1.3D - Transforming information can be effective in communicating knowledge gained from data.
3.2 - Computing facilitates exploration and the discovery of connections in information.
3.2.1 - Extract information from data to discover and explain connections, patterns, or trends. [P1]
- 3.2.1A - Large data sets provide opportunities and challenges for extracting information and knowledge.
- 3.2.1B - Large data sets provide opportunities for identifying trends, making connections in data, and solving problems.
- 3.2.1C - Computing tools facilitate the discovery of connections in information within large data sets.
7.3 - Computing has a global affect -- both beneficial and harmful -- on people and society.
7.3.1 - Analyze the beneficial and harmful effects of computing. [P4]
- 7.3.1H - Aggregation of information, such as geolocation, cookies, and browsing history, raises privacy and security concerns.
- 7.3.1J - Technology enables the collection, use, and exploitation of information about, by, and for individuals, groups, and institutions.
CSTA K-12 Computer Science Standards (2017)
DA - Data & Analysis
- 3B-DA-05 - Use data analysis tools and techniques to identify patterns in data representing complex systems.
- 3B-DA-06 - Select data collection tools and techniques to generate data sets that support a claim or communicate information.