Lesson 1: What is Big Data?
Overview
In this lesson, students are introduced to the concept of “big data,” where it comes from, what makes it “big,” and how people use big data to solve problems. Students are asked to consider how much of their lives are “datafied” or could be, and the teacher will show the projected growth of data in the world. Students will then investigate a big data tool in pairs to evaluate the tool for its usefulness and investigate the source of the data used to make the tool. A key take-away from the lesson is that different considerations need to be made when trying to look at, use, or analyze tools that use big data. The world of big data is big, and we’ve only begun to figure out how to solve problems with it.
The lesson concludes with a brief introduction to the AP Explore Performance Task which students are recommended to complete at the end of the unit.
Purpose
Big data is a big deal right now, both in the field of computer science and more broadly across fields and industries. Understanding the types of things that can be captured in data and anticipating the types of innovations or new knowledge that can be built upon this data is increasingly the role of the computer scientist. A first step toward understanding big data is a survey of how big data is already being used to learn and solve problems across numerous disciplines. The scale of big data makes it hard to “see” sometimes, and techniques for looking at, working with, and understanding data change once the data is “big.” Everything, from how it’s stored to how it’s processed to how it's visualized, is a little different once you enter the realm of big data.
Agenda
Getting Started (20 mins)
Activity (30 mins)
Wrap-up (20 mins)
Extended Learning
Assessment
View on Code Studio
Objectives
Students will be able to:
- Identify sources of data produced, used, and consumed by a web application.
- Given a tool that provides access to a large dataset, explain the kinds of problems such a tool could solve.
- Use a tool that provides access to “big data” and investigate its sources.
- Explain that new techniques are necessary to store, manage, transmit, and process data at the scale it is currently being produced.
Links
Heads Up! Please make a copy of any documents you plan to share with students.
For the Students
- College Board - Assessment Overview and Performance Task Directions for Students
- Activity Guide - Big Data Sleuth Card - Activity Guide
- Big data is better data - TED talk - Video
Vocabulary
- Big Data - a broad term for datasets so large or complex that traditional data processing applications are inadequate.
- Moore's Law - a predication made by Gordon Moore in 1965 that computing power will double every 1.5-2 years, it has remained more or less true ever since.
Teaching Guide
Getting Started (20 mins)
Video: Big data is better data
Discussion Goal
Goal: Get students acquainted with the world of big data. Do some simple investigations into some tools that use big data to get a sense of where the data comes from and how it’s used.
Teaching Tip
Timing: This is a rather long Getting Started activity, due to the length of the video. Note that the main activity is shorter to compensate.
Video: Big data is better data - TED talk - Video
Prompt: Based on what you saw in the video, what is big data?
Discuss: In small groups, have students share their responses. Afterwards, open the discussion to the whole class. The main points to draw out from this conversation are:
Big data means different things, at different times, to different people.
- It can mean devices that are constantly collecting data.
- It can mean digitizing data that’s been around for a long time (e.g., every book ever written).
- It can mean machine learning and artificial intelligence.
Activity (30 mins)
Teaching Tip
Time check: You should spend at most 10 minutes with exponential growth and Moore's law. Most of the time should be spent working on the "Big Data Sleuth" activity that follows.
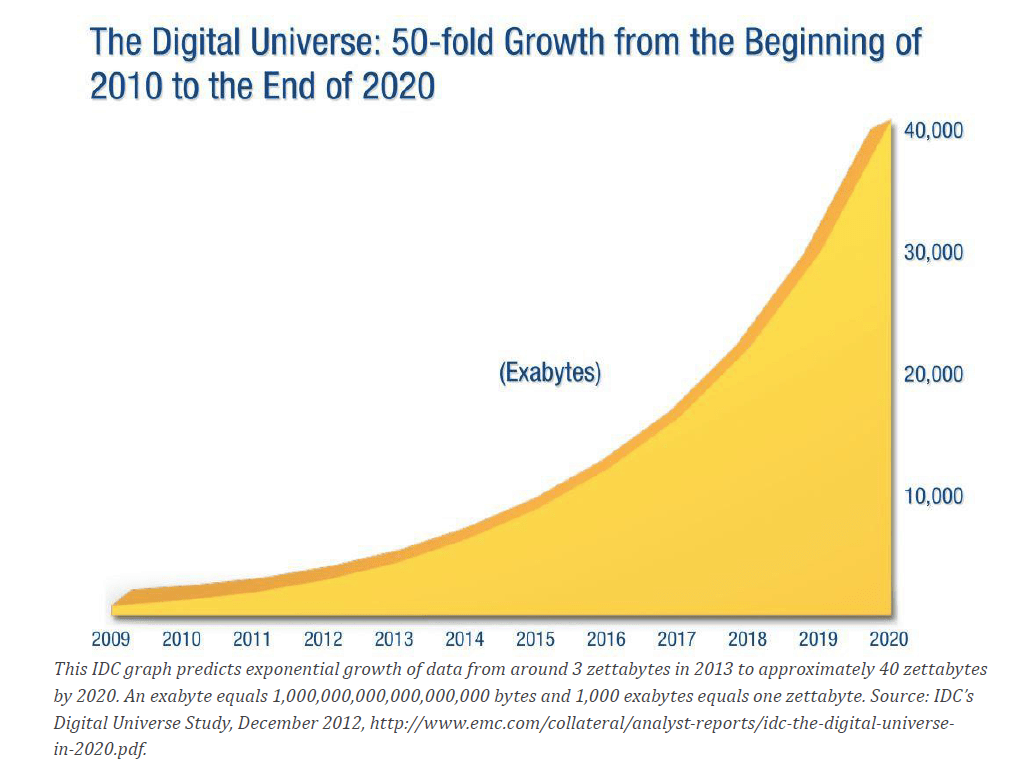
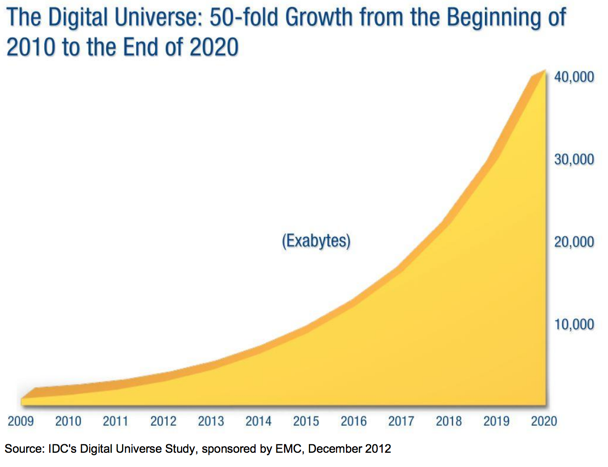
Data Graphic: (Note: This graphic is available for students on Code.org website) The IDC’s “Digital Universe” is described as “a measure of all the digital data created, replicated, and consumed in a single year.” source: http://www.emc.com/collateral/analyst-reports/idc-the-digital-universe-in-2020.pdf
Exponential Growth and Moore's Law (10 mins)
Display: Direct students to the graphic showing the exponential growth of data, either by projecting it or having them find it on the Code.org website.
Remarks
Part of what contributes to data being "big" is the sheer growth of the amount of data in the world. Let’s have a look at a graph that shows us just how large big data is.
As you can see from the chart, the amount of data flying around is growing exponentially, doubling every two years or so. Here’s a way to think about how fast this is: The world will produce as much digital data over the next 2 years, as currently existed in all of humanity prior to that. And it will do the same the 2 years after that. And so on. That’s a lot!
Moore's Law
Teaching Tip
Keep It Simple: Students only need to have a sense of what Moore's Law is for purposes of putting a name to a description of how fast computing capacity grows, and to understand what it means if they come across it when reading something.
The only reference to it in the framework is this:
7.2.1F Moore's law has encouraged industries that use computers to effectively plan future research and development based on anticipated increases in computing power.
Teaching Options:
- Presentation: You can simply give the remarks provided
- Rapid Reseach: Have students do some "rapid research" on Moore's Law and come back with some answers to collectively discuss.
Briefly introduce Moore's Law as simple piece of vocabulary.
However you do it, here are some key ideas students need to know about Moore's Law:
- Moore's law is actually about computing power, not data, but data growth seems to following the same trend
- So far, computing power/capacity seems to double every 1.5-2 years...
- That means it grows exponentially...
- Exponential growth is hard for humans to fathom...
- Yet we need to plan for it.
Content Corner
Moore's Law: While the exponential growth principle is the same for data storage as it is for computing power/speed, it’s worth noting that Moore’s Law actually never referred to data storage capacity, only the number of transistors on a chip.
However, the phrase “Moore’s Law” has come to be used colloquially to refer to the idea that in computers and information technology everything seems to double - speed, size, capacity - every 1.5-2 years.
Moore's Law Remarks
There is a principle in computer science known as Moore's Law.
It is not a law of nature or mathematics but simply a surprisingly accurate prediction that was made a long time ago. In 1965, a computer chip designer named Gordon Moore predicted that the number of transistors one could fit on a chip would double every 18 months or so.
Amazingly, that prediction has more or less held true to the present day! The result is that since about 1970, computers have gotten twice as fast, at half the cost, roughly every 1.5-2 years. With some small differences, the same is true for data storage capacity.
This is extraordinarily fast growth - we call it exponential growth. With more and more machines that are faster and faster, the amount of data being pushed around, saved, and processed is growing exponentially. This is so fast that it's hard to fathom and even harder to plan for. For example:
- If the average hard drive today is 1 TB and you are planning for something or 6 years away, you should expect that average hard drives will be 8-10 TB.
Key Takeaway: We need to keep Moore’s Law in mind as we plan for the future.
Big Data Sleuth Card (20 mins)
Distribute: Activity Guide - Big Data Sleuth Card - Activity Guide.
Remarks
Big data surrounds us but it is sometimes surprisingly challenging to get access to it, use it, or see it. Much of the data out there is in the “wild.” Even when the data is “available,” it can sometimes be challenging to figure out where it came from, or how to use it.
Put students into pairs and assign each pair one of the 5 websites listed.
- Web archive http://www.archive.org
- Measure of America http://www.measureofamerica.org/maps/
- Wind Sensor network http://earth.nullschool.net/
- Twitter sentiment https://www.csc.ncsu.edu/faculty/healey/tweet_viz/tweet_app/
- Alternative Fuel Locator http://www.afdc.energy.gov/locator/stations/
Student tasks are to follow the resource and answer prompts related to:
- the visualization tool provided
- the original source of the data
- evaluating the usefulness of both the data and the visualization.
Wrap-up (20 mins)
Big Data Wrap Up (10 mins)
Discussion Goal
Goal: Aim to develop some fluency in talking about the different kinds of data that are available and how they are being used. Students also have an opportunity to assess the usefulness of data visualizations in a new context, now that the scale of data will be much larger.
This is a tricky question that a) doesn't have a fixed definition - whether data is "big" often depends on the context of the data itself or how it's trying to be used and b) even experts might have difficulty pinning it down.
Try to coax student responses toward ideas that discuss using different, new, or unheard of methods or techniques for extracting information from data. The amount of data you have can lend itself to new techniques and this is often what people mean when talking about the "awesomeness" of Big Data.
Share: Students should share their results from the Big Data Sleuth Cards with members of another group. This can also be conducted as a classwide discussion.
- What kinds of data are out there?
- What format does it come it?
- Where does it come from?
- Did anyone find a link to an actual data source?
- Did anyone find an API? What’s an API?
Prompt: After your explorations what do you think "big data" actually means? What makes it "big" as opposed to not?*"
Discuss: Have students share their thoughts with a neighbor. Then share more broadly with the class.
Remarks
Here is a general-purpose definition of Big Data (taken from Wikipedia: Big Data): “Big data is a broad term for datasets so large or complex that traditional data processing applications are inadequate." The fact that big data is increasingly important across industries reflects rapid changes in how much data we're collecting, and the ways we're using it.
In this unit we're going to be looking into how growth in data and computing more generally is impacting society. In almost every industry and every aspect our lives, computing and data is affecting our lives in both positive and negative ways. This will also be very useful preparation as we begin to look towards the Explore PT.
Teaching Tip
You should be aware that there is a full lesson devoted to Explore PT prep available in the "AP Explore PT Prep" unit. That lesson:
- Does a deeper dive into the task
- Looks at the scoring guidelines
- Reviews scored samples of projects
- Begins the process of preparing to do the real task.
You might want to find a time between this lesson and the end of Unit 4 to take a look at it with your students so they can have some time for the task to sink in.
Explore PT discussion goals
Goals:
- Students are aware they will be completing the Explore PT after the conclusion of the Unit
- Students are aware that they will need to 1) research an innovation of interest 2) create a computational artifact 3) respond to written reflections
- Students are aware they will practice these skills throughout and at the conclusion of this unit.
Keep it short: Avoid making this a 45-minute deep-dive review of the AP Explore PT and all its components - a surface level understanding is all that is needed to proceed. Practice questions and direct references to College Board materials are included in each of the next few lessons. This is a kickoff discussion, and you will have many opportunities to prepare students for the PT in later lessons.
Introduce Explore PT (10 mins)
Distribute: Give students digital or printed copies of College Board - Assessment Overview and Performance Task Directions for Students. We will review pages 4-6 which introduces the Explore PT Components (Digital copy linked to from student resource section for this lesson on the Code.org website).
Remarks
At the end of this unit we will be doing the Explore PT. To practice the different components of the PT we'll be practicing them throughout this unit. We're going to quickly review those components now, but we'll have opportunities to review and practice them in the next few lessons as well. For right now you don't need to understand all the details, just the big picture.
Review: Quick skim this document with the class, touching on the following points.
- Page 4: The Explore PT has 2 major components, 1. computational artifact, 2. written responses
- Pages 5-6: Skim the submission requirements and give students time to read prompts 2a - 2e.
- Highlight prompts 2c and 2d which references beneficial / harmful effects and the way computing innovations use data, themes of this unit.
Discuss: Respond to any questions students share. Don't lose too much time here. You'll have many opportunities to review the Explore PT in later lessons.
Extended Learning
Open Data: You might be interested in looking at some of the publicly available datasets provided at these sites. It can take a little digging, but you can see the raw datasets and some of the applications that have been made from them.
Google Maps Traffic: Another big data resource that students may use every day:
- Go to maps.google.com and zoom in on your town or city.
- Turn on the Live Traffic view for your area or a nearby town or city.
- The map should show real-time traffic data.
- Have students respond to the same set of questions that they did on the Big Data Sleuth Card. This may take a little more research, since the sources of the data aren’t as clearly marked.
Assessment
TBD
- Lesson Vocabulary & Resources
- 1
Student Instructions
Unit 4: Lesson 1 - What is Big Data?
Overview
Introduction to the concept of "big data," where it comes from, what makes it "big," and how people use big data to solve problems, and how much of their lives are "datafied" or could be.
The lesson concludes with a brief introduction to the AP Explore Performance Task which students are recommended to complete at the end of the unit.
Vocabulary
 Click to enlarge.
- Moore's Law: the observation that computing power roughly doubles every two years.
- Big Data: a broad term for datasets so large or complex that traditional data processing applications are inadequate.
Lesson
- Video - Big Data is Better Data
- Where do we use data? Where does it come from?
- Explore a data visualization and identify its sources
- Introduce the Explore PT
Resources
Teaching Tip
Moore's Law is discussed at length in the lesson plan as a lead-in to the "Big Data Sleuth" activity.
Moore's Law - a predication made by Gordon Moore in 1965 that computing power will double every 1.5-2 years, it has remained more or less true ever since.
For purposes of the AP exam a looser definition is supported - Moore's Law: the observation that computing power roughly doubles every two years.
Student Instructions
Teaching Tip
The typical threshold for "Big Data" is when common desktop tools and techniques for handling, processing and manipulating data are not enough. This is not a hard and fast definition, but the important note is that what makes it "big" is not only a function of the number of bytes, but how it needs to be processed as well.
Student Instructions
- Quick Check-In
- 4
Student Instructions
This level is an assessment or survey with multiple questions. To view this level click the "View on Code Studio" link.
Standards Alignment
View full course alignment
Computer Science Principles
3.2 - Computing facilitates exploration and the discovery of connections in information.
3.2.2 - Use large data sets to explore and discover information and knowledge. [P3]
- 3.2.2A - Large data sets include data such as transactions, measurements, text, sound, images, and video.
- 3.2.2B - The storing, processing, and curating of large data sets is challenging.
- 3.2.2C - Structuring large data sets for analysis can be challenging.
- 3.2.2D - Maintaining privacy of large data sets containing personal information can be challenging.
- 3.2.2E - Scalability of systems is an important consideration when data sets are large.
- 3.2.2F - The size or scale of a system that stores data affects how that data set is used.
- 3.2.2G - The effective use of large data sets requires computational solutions.
- 3.2.2H - Analytical techniques to store, manage, transmit, and process data sets change as the size of data sets scale.
7.2 - Computing enables innovation in nearly every field.
7.2.1 - Explain how computing has impacted innovations in other fields. [P1]
- 7.2.1A - Machine learning and data mining have enabled innovation in medicine, business, and science.
- 7.2.1B - Scientific computing has enabled innovation in science and business.
- 7.2.1C - Computing enables innovation by providing access to and sharing of information.
- 7.2.1D - Open access and Creative Commons have enabled broad access to digital information.
- 7.2.1E - Open and curated scientific databases have benefited scientific researchers.
- 7.2.1F - Moore's law has encouraged industries that use computers to effectively plan future research and development based on anticipated increases in computing power.
- 7.2.1G - Advances in computing as an enabling technology have generated and increased the creativity in other fields.
7.5 - An investigative process is aided by effective organization and selection of resources. Appropriate technologies and tools facilitate the accessing of information and enable the ability to evaluate the credibility of sources.
7.5.2 - Evaluate online and print sources for appropriateness and credibility [P5]
- 7.5.2A - Determining the credibility of a soruce requires considering and evaluating the reputation and credentials of the author(s), publisher(s), site owner(s), and/or sponsor(s).
- 7.5.2B - Information from a source is considered relevant when it supports an appropriate claim or the purpose of the investigation